Online Free Pie Chart Maker
Present your data with a pie chart to show the difference for each part of the whole.
Fotor's free online pie chart maker helps you create your own pie chart easily.
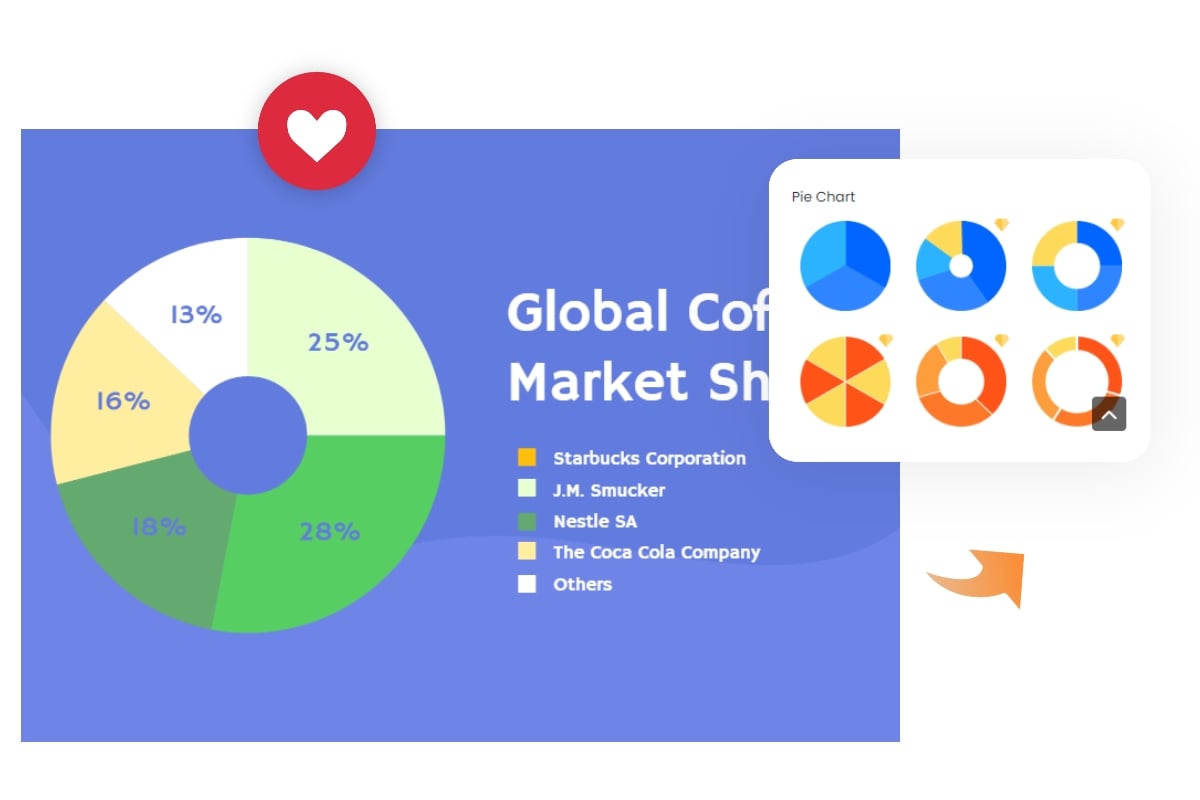
Make a Pie Chart Instantly
Create a pie chart online with Fotor's pie chart maker instantly. Get started with our professional pie chart templates without any Photoshop skills. Fotor offers types of pie charts for different situations. To create a pie chart, just browse and choose a pie chart type to fit the specific needs for your projects, and insert your data. With Fotor’s pie chart maker, you can easily create pie charts in a few clicks.
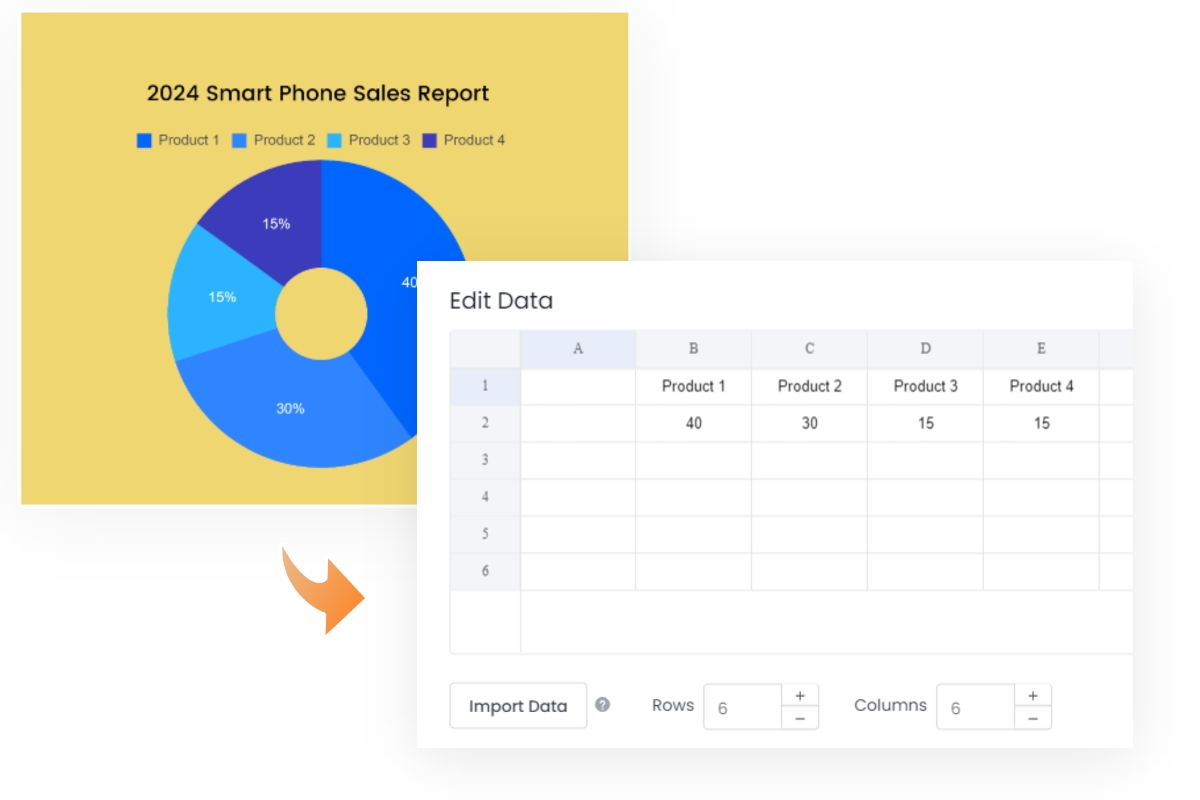
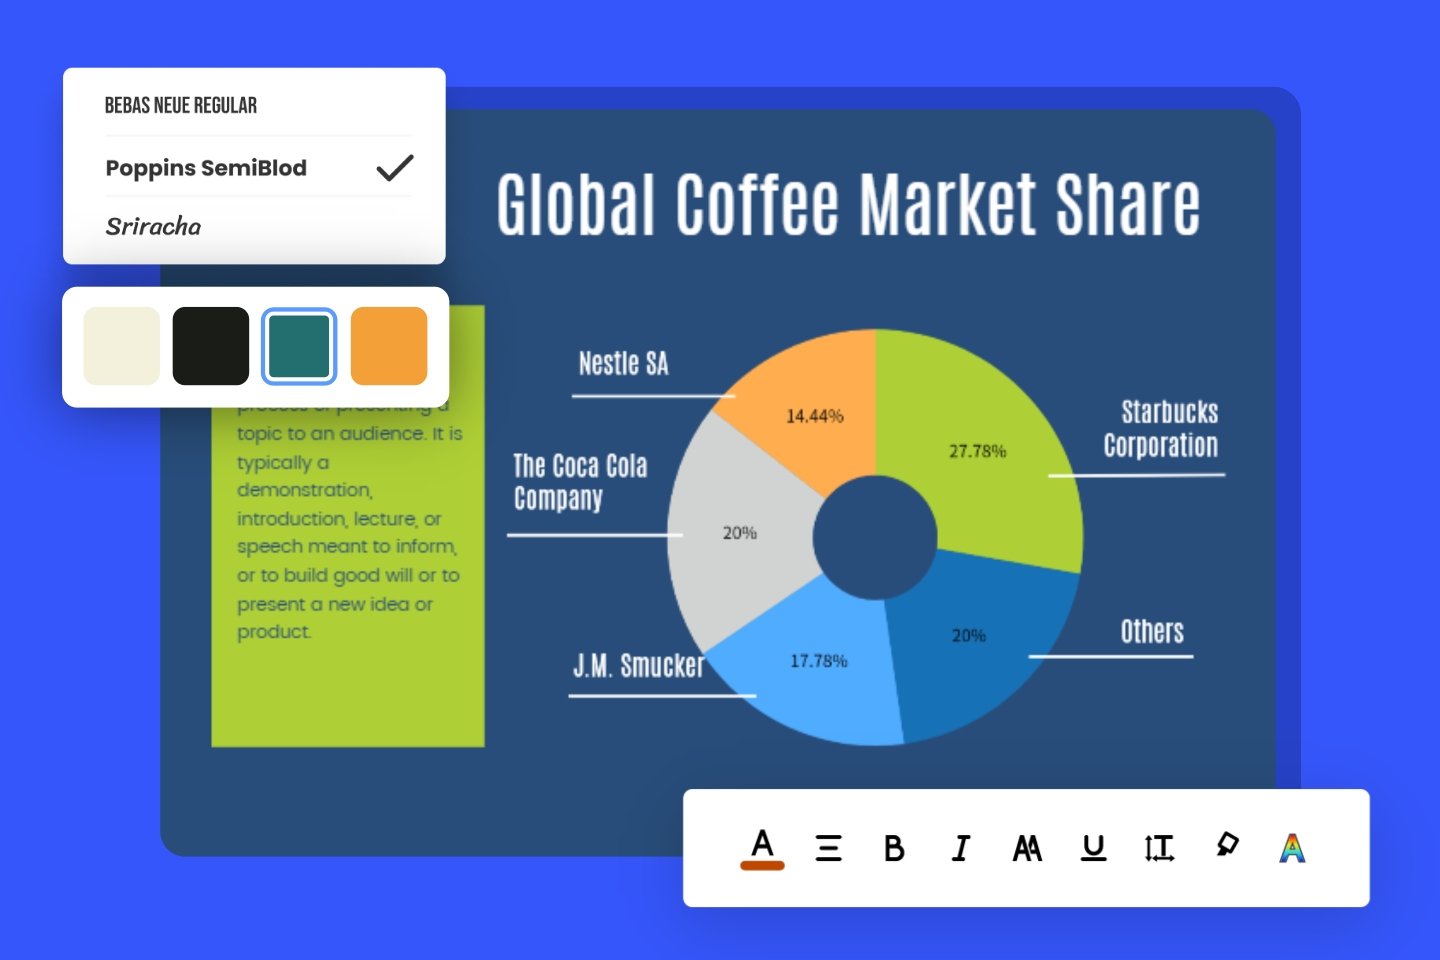
Visualize Your Data with Fotor’s Pie Chart Generator
Fotor's online pie chart generator makes it easy to convert your original data into an eye-catching pie chart, and arrange the data slices in a circular graph at the correct scale. You can enter the data directly or upload your excel chart to our pie chart creator and make visualizable data in an intuitive way.
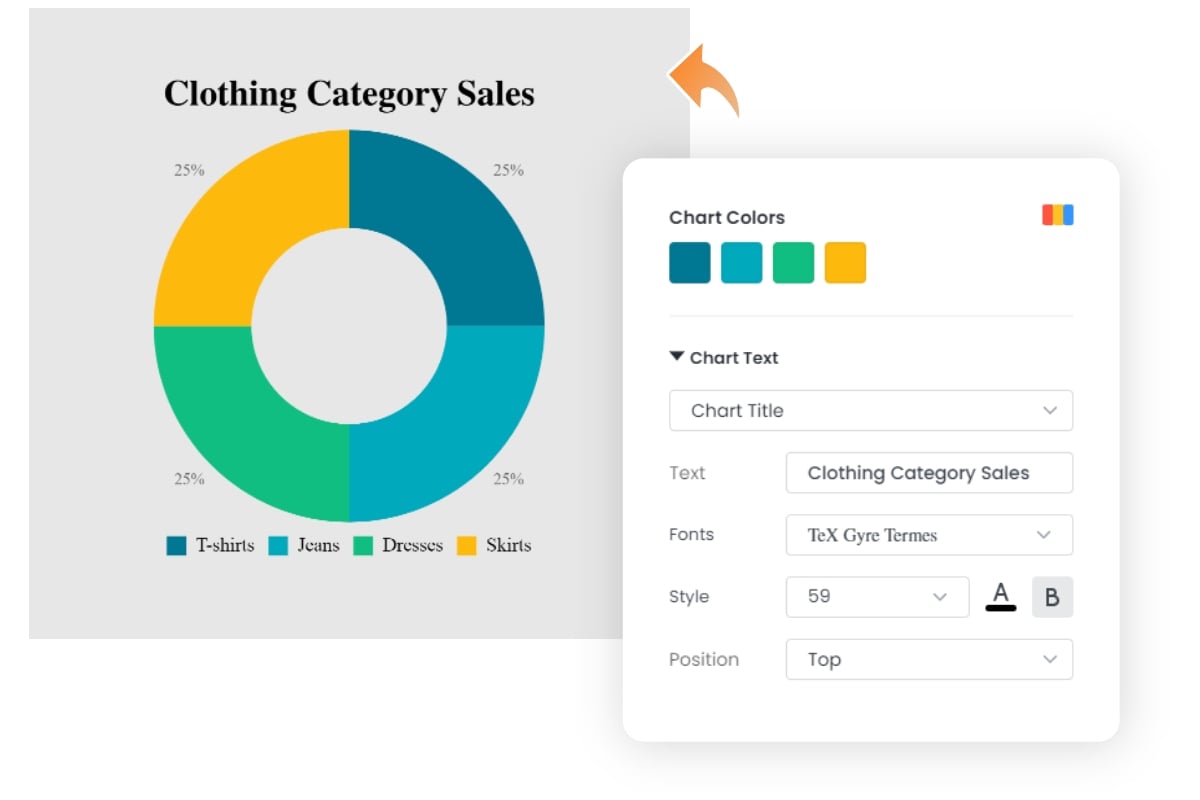
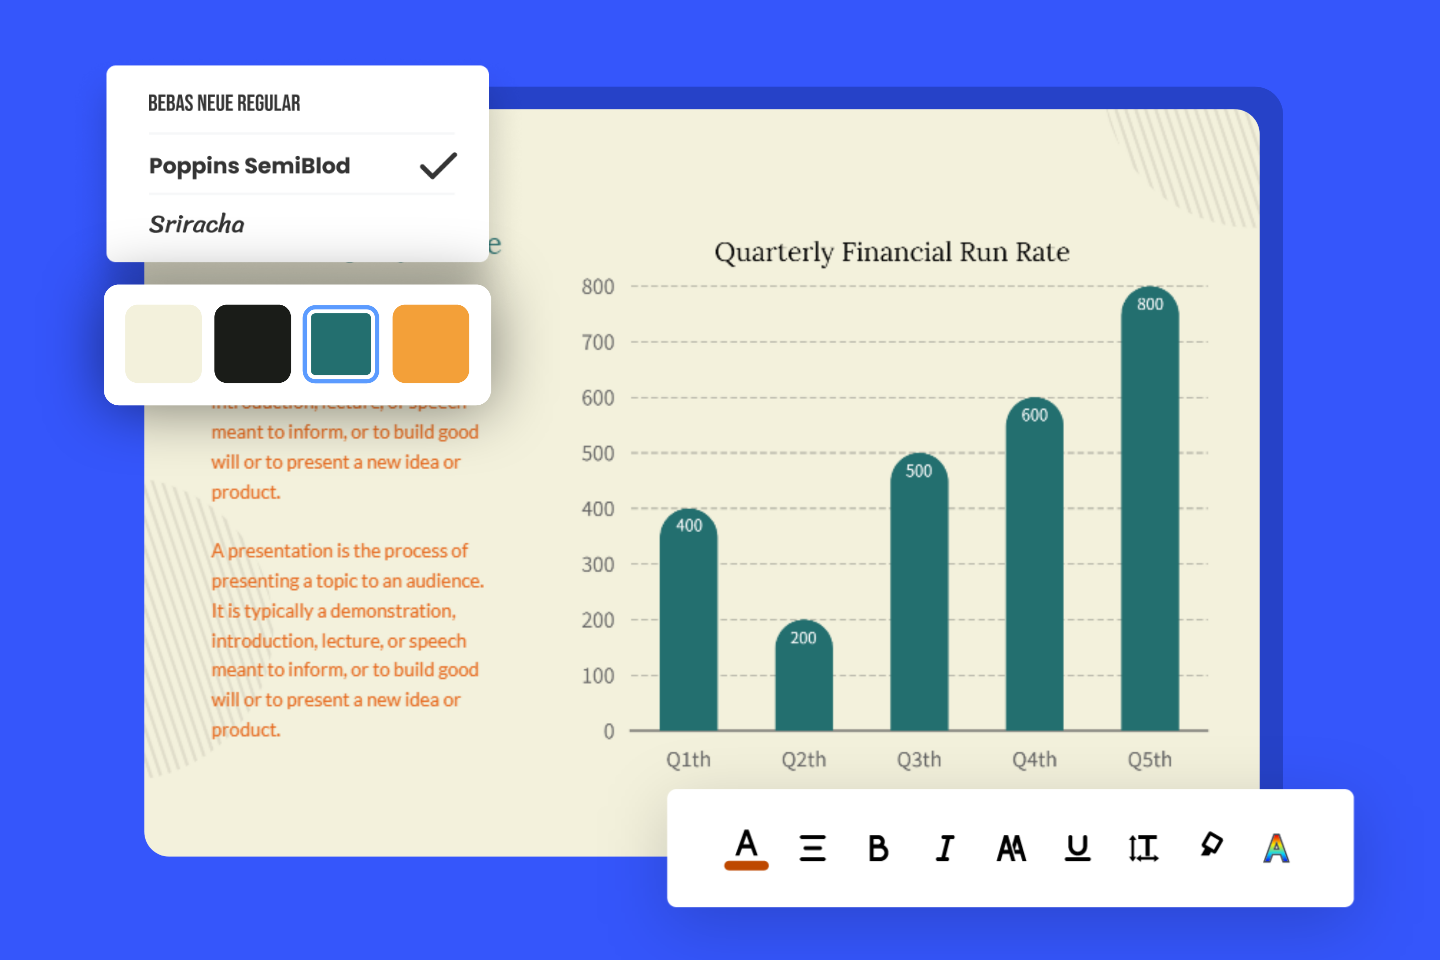
Customize Circle Charts as You Wish
Get rid of boring data and make your pie chart stand out. Customize your pie chart using the editable elements built into Fotor's circle graph maker. You can easily adjust any aspect of the pie chart to visualize your data, and take your pie graph design to the next level by changing backgrounds, colors, fonts, etc. All of these are great ways to make pie charts stand out and make the data clear at a glance.

Share the High-Quality Pie Chart with Your Team
Share the visual data with your team for more efficient communication. With Fotor's pie chart maker, you can easily create a pie graph to showcase your project data and download it as a high-quality image to share with your team or post on social media. JPG, PNG, and PDF file formats are supported.

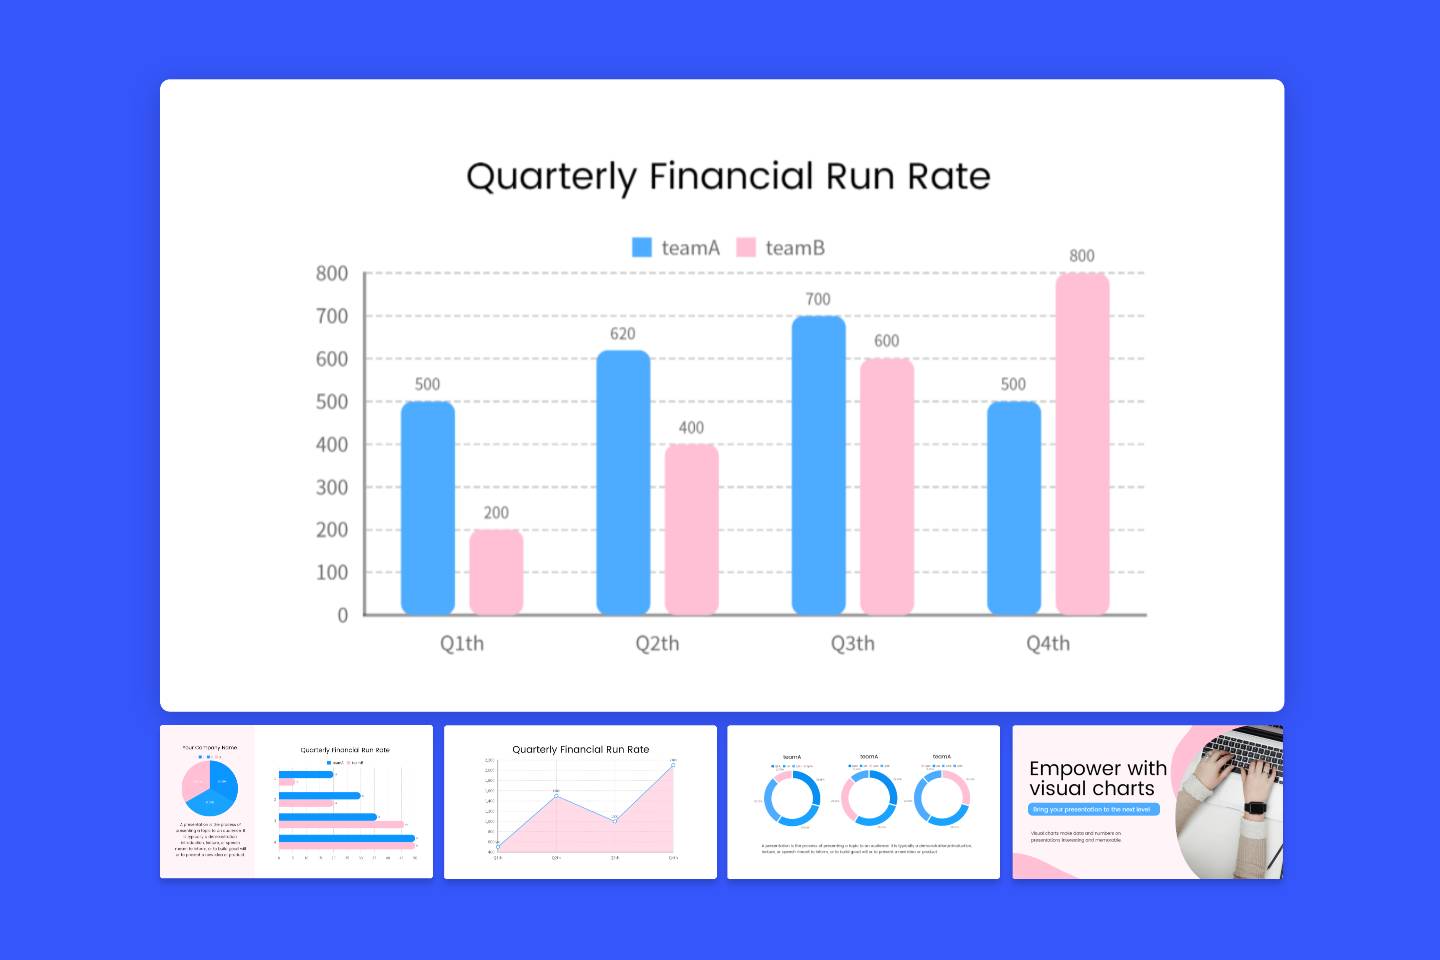
Insert Pie Charts in Your Presentations, Reports
With Fotor's pie chart maker, you can easily create a pie chart and insert it into any presentation document or other report. Combine with Fotor's presentation templates to create an impactful report with a pie chart, which will impress your audience and help in data analysis. You can also download the image to share on social media, or embed your circle chart on your website or blog.
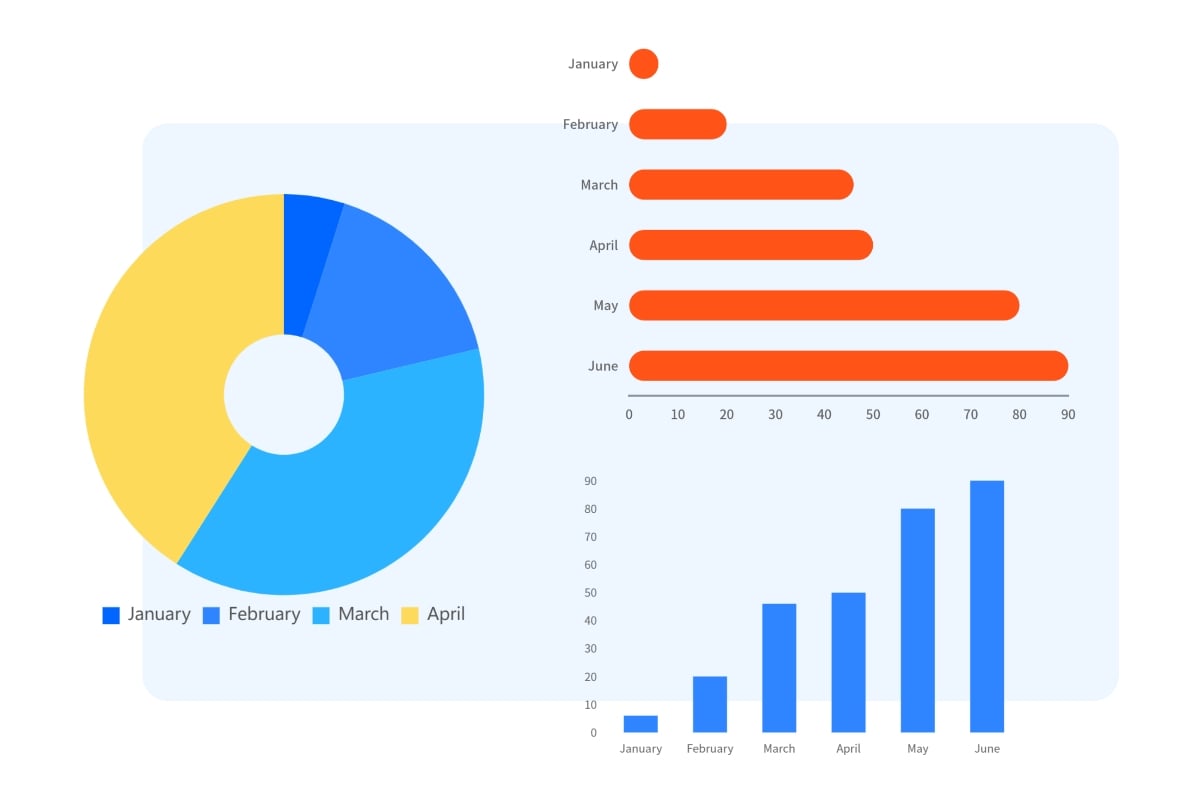
Not Only a Pie Graph Maker
You can not only make pie charts online, but also bar graphs, and line graphs with the chart designing tool. These all support you to provide greater feedback on data changes.