Graphic Design Solutions Hub
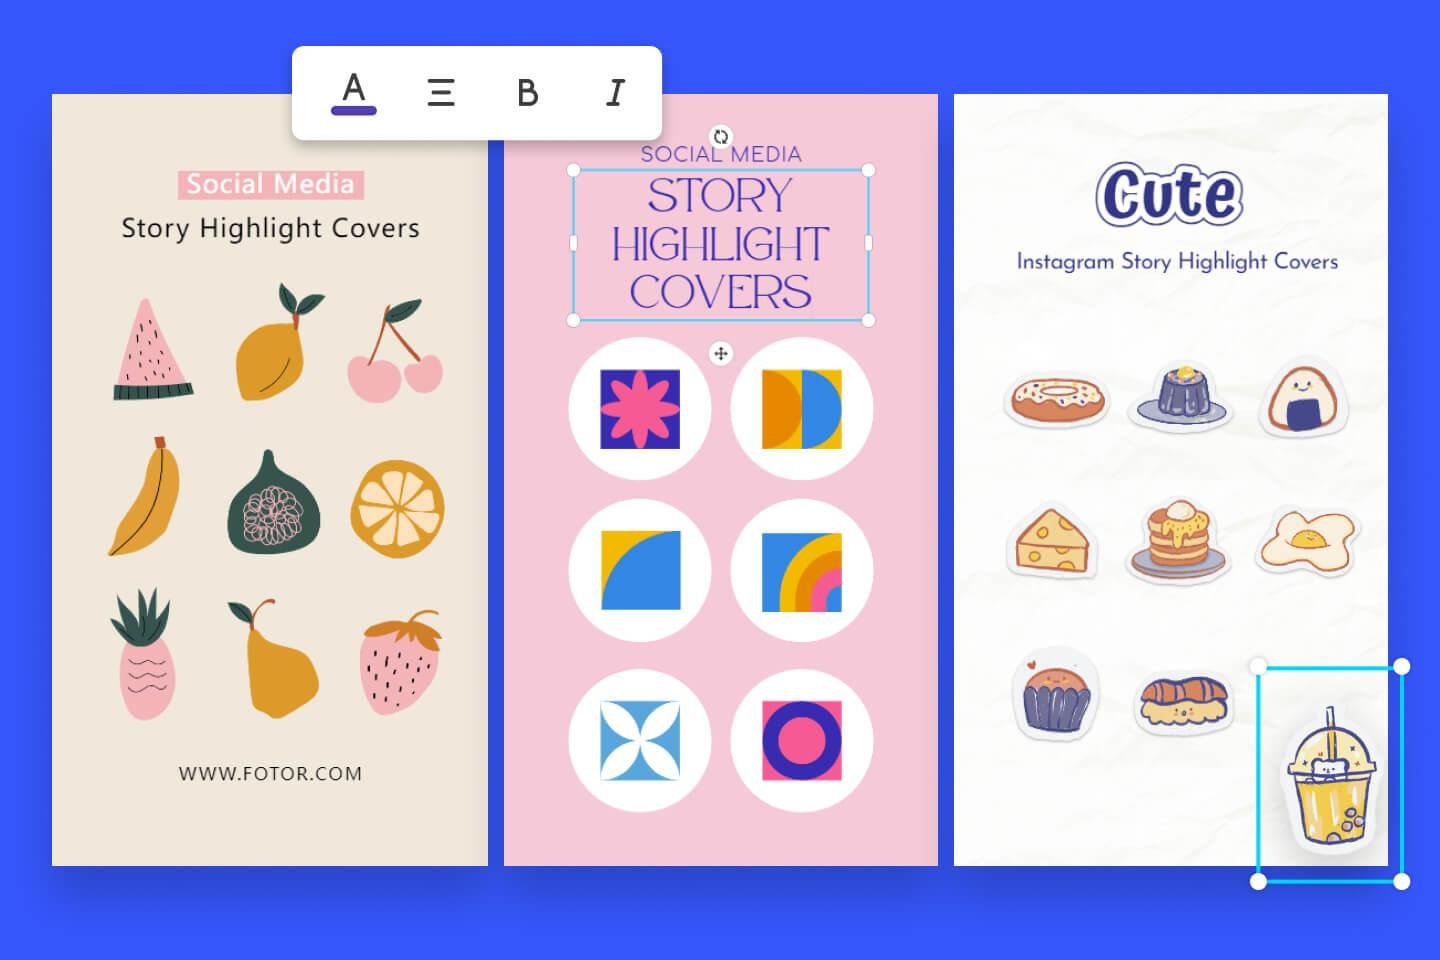
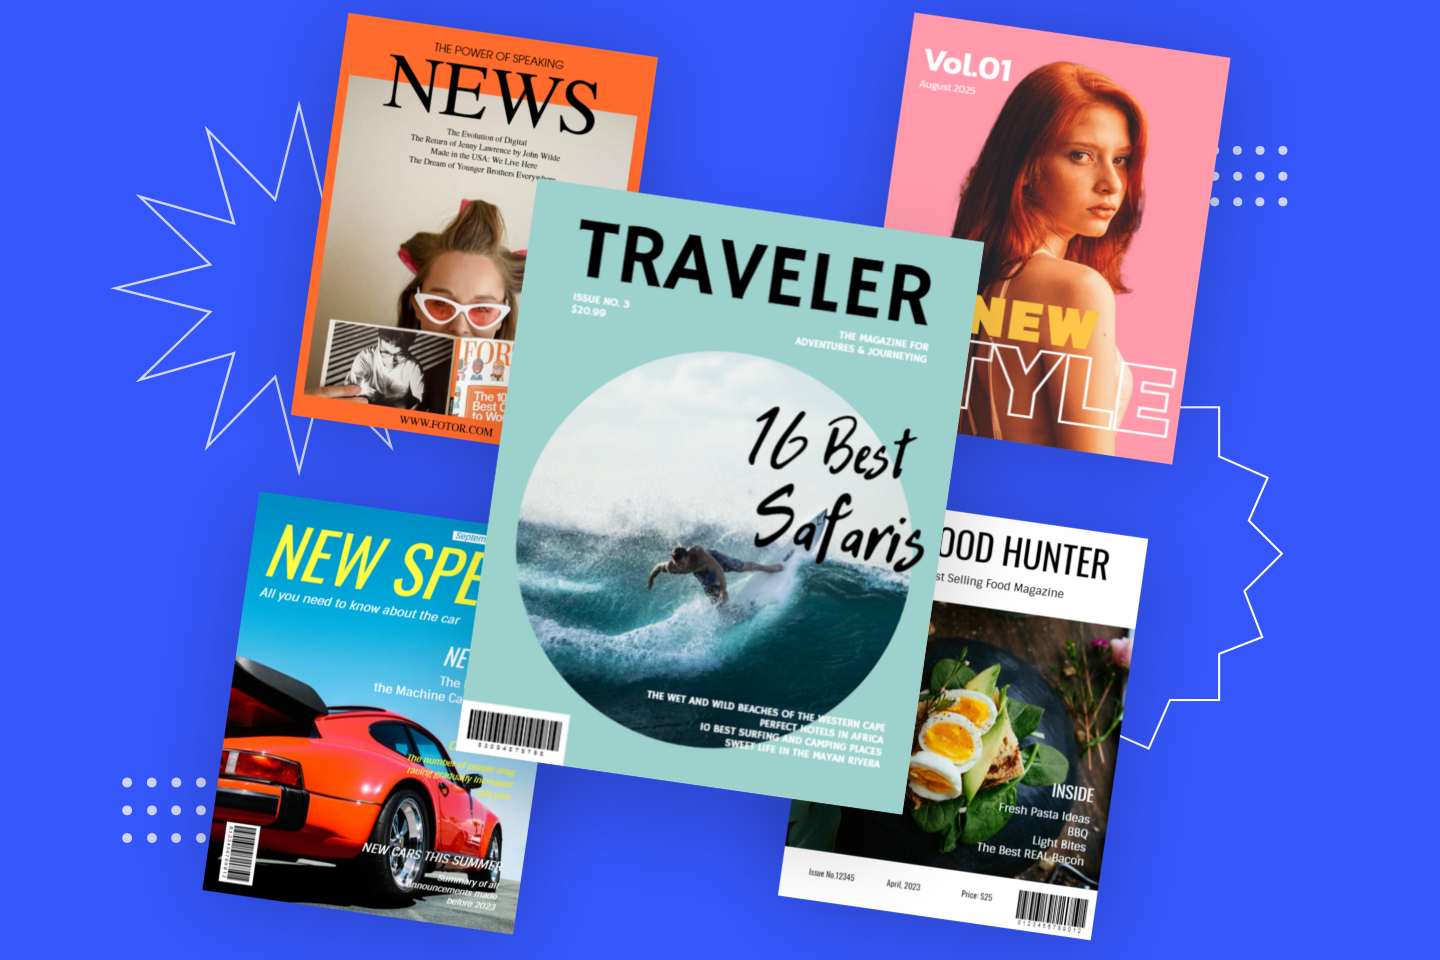
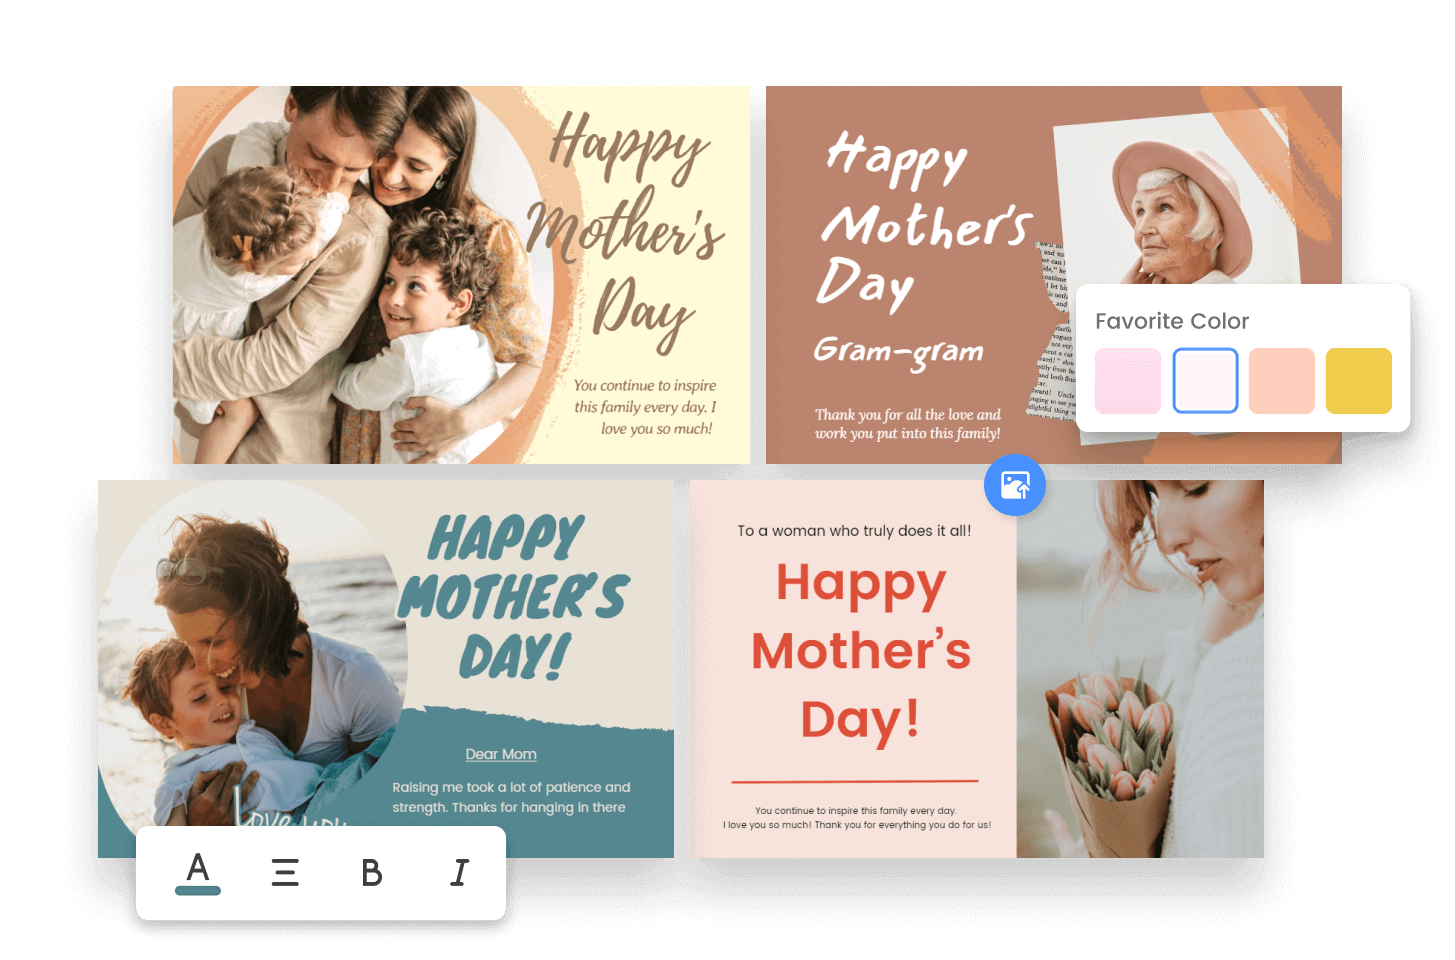
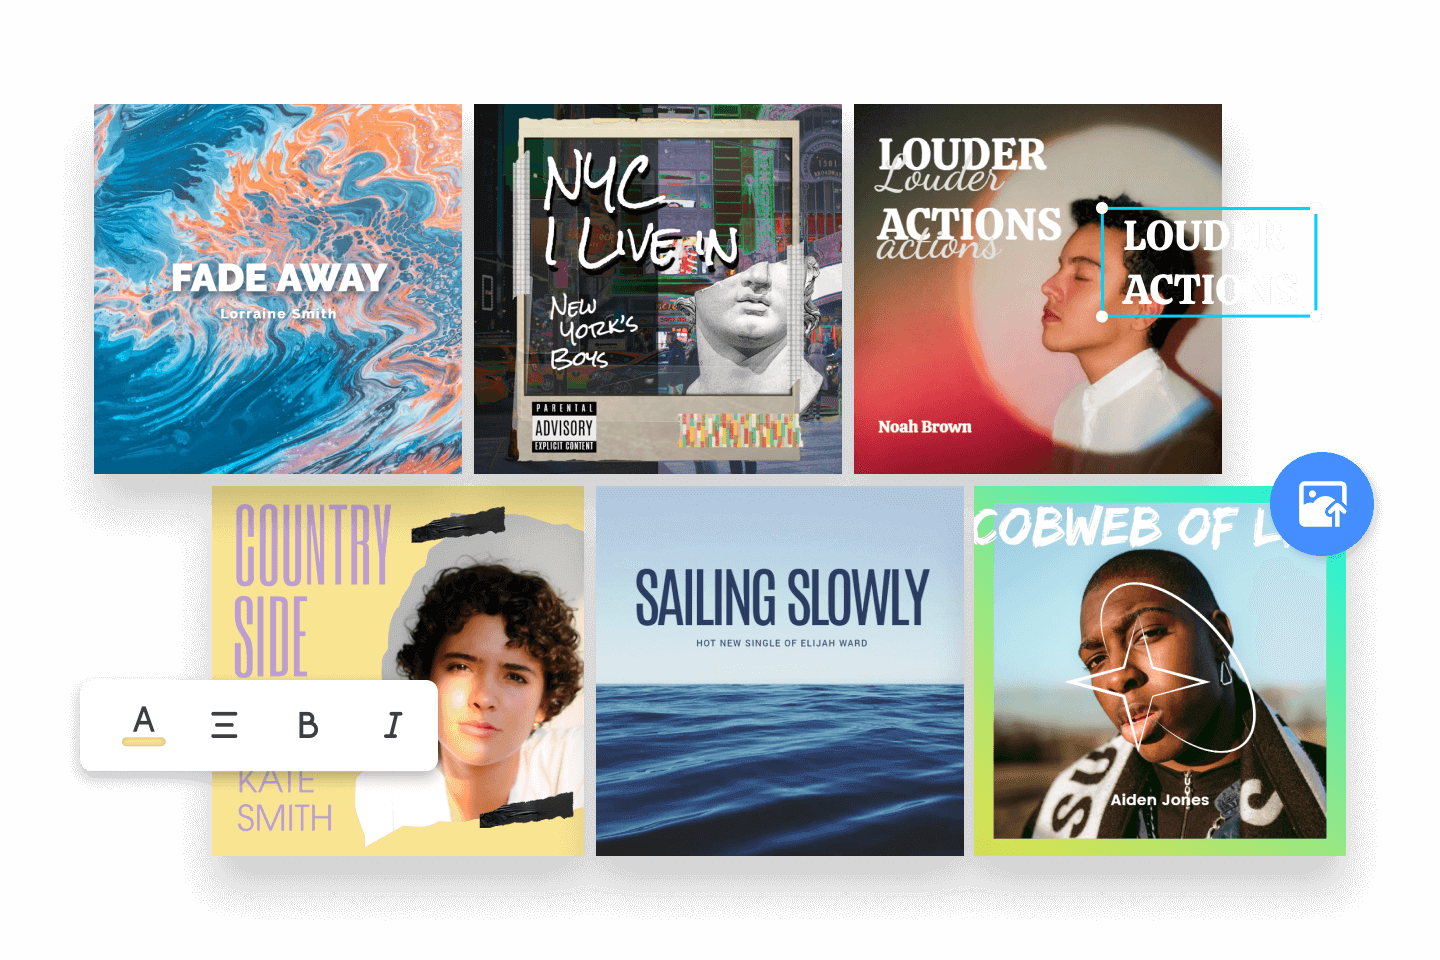
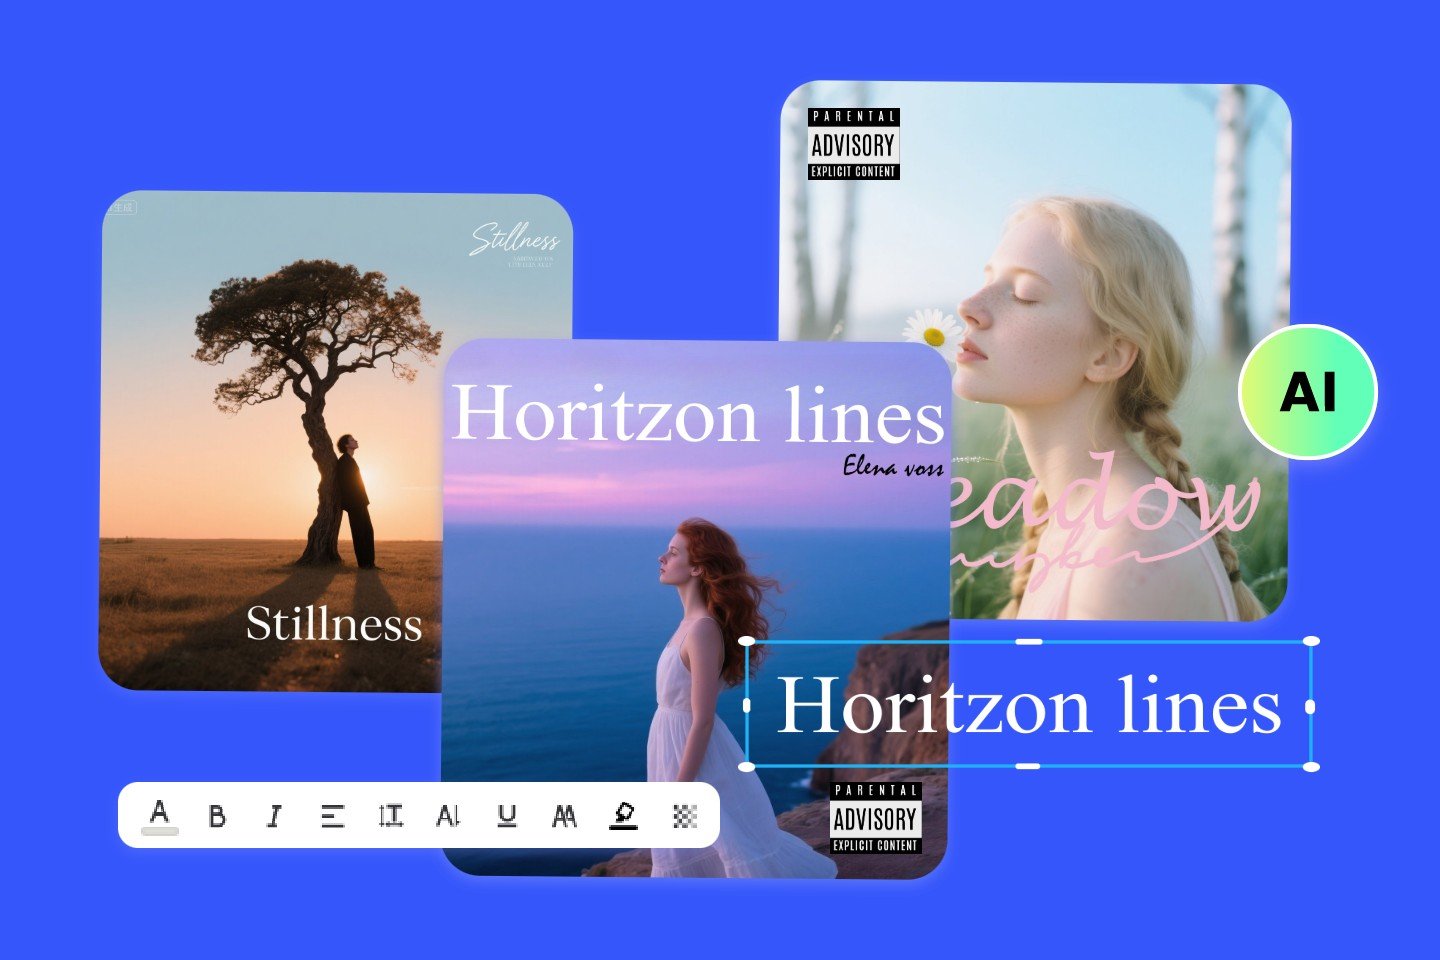
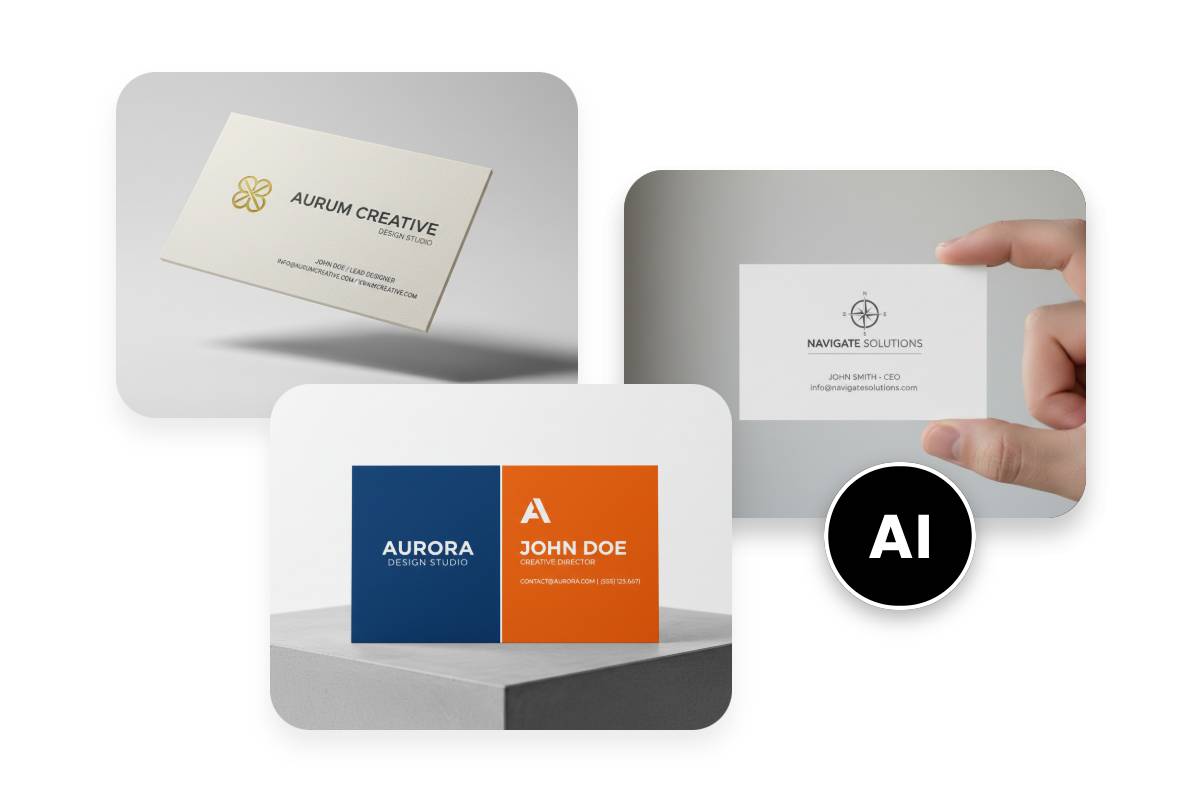
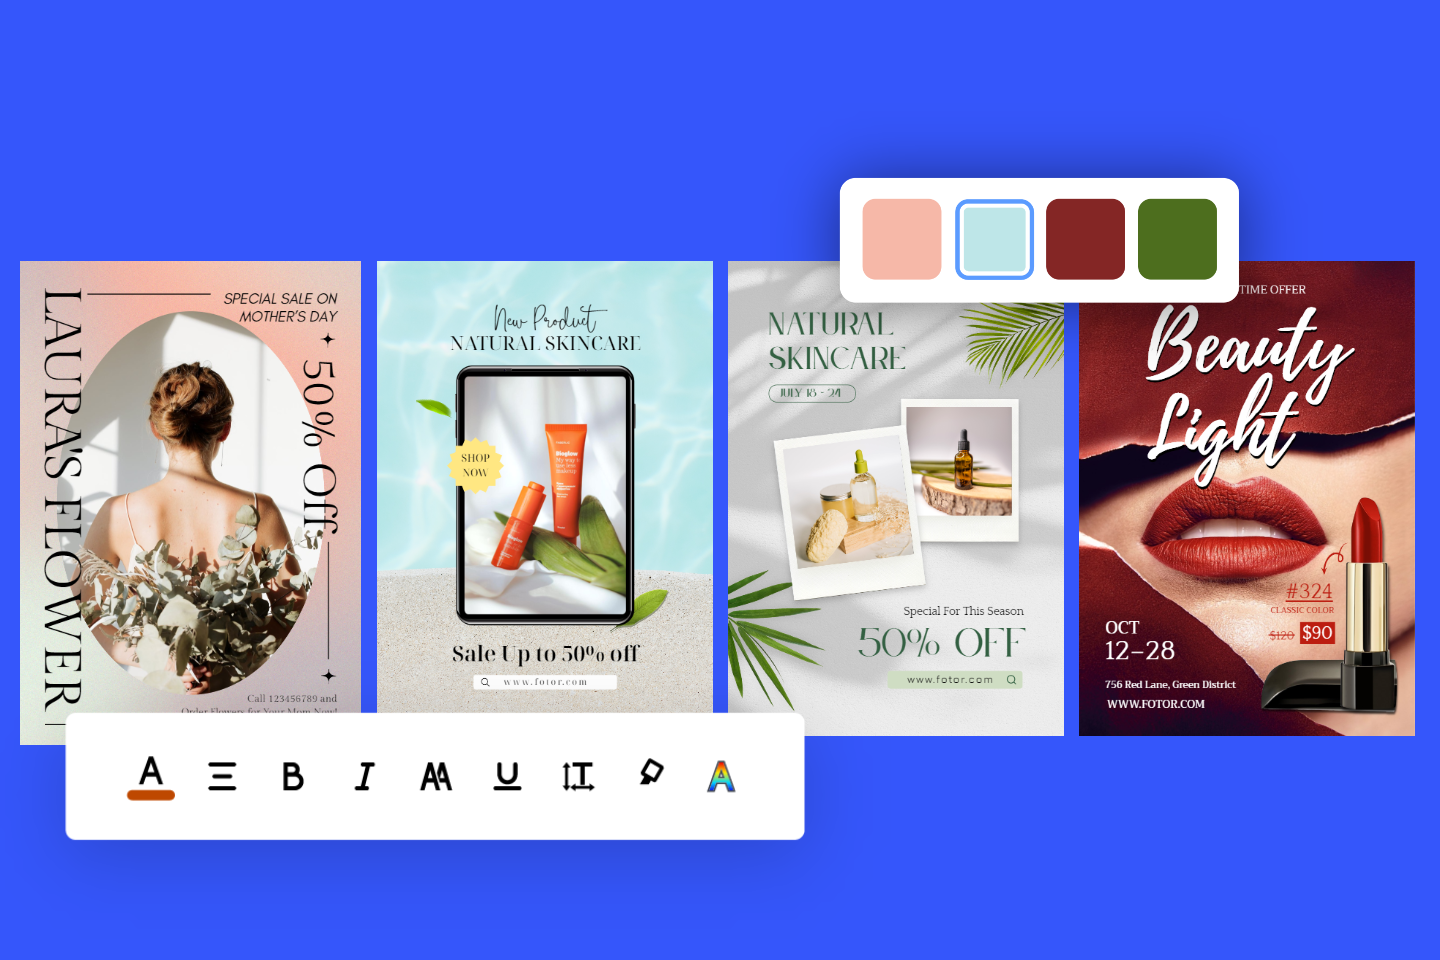
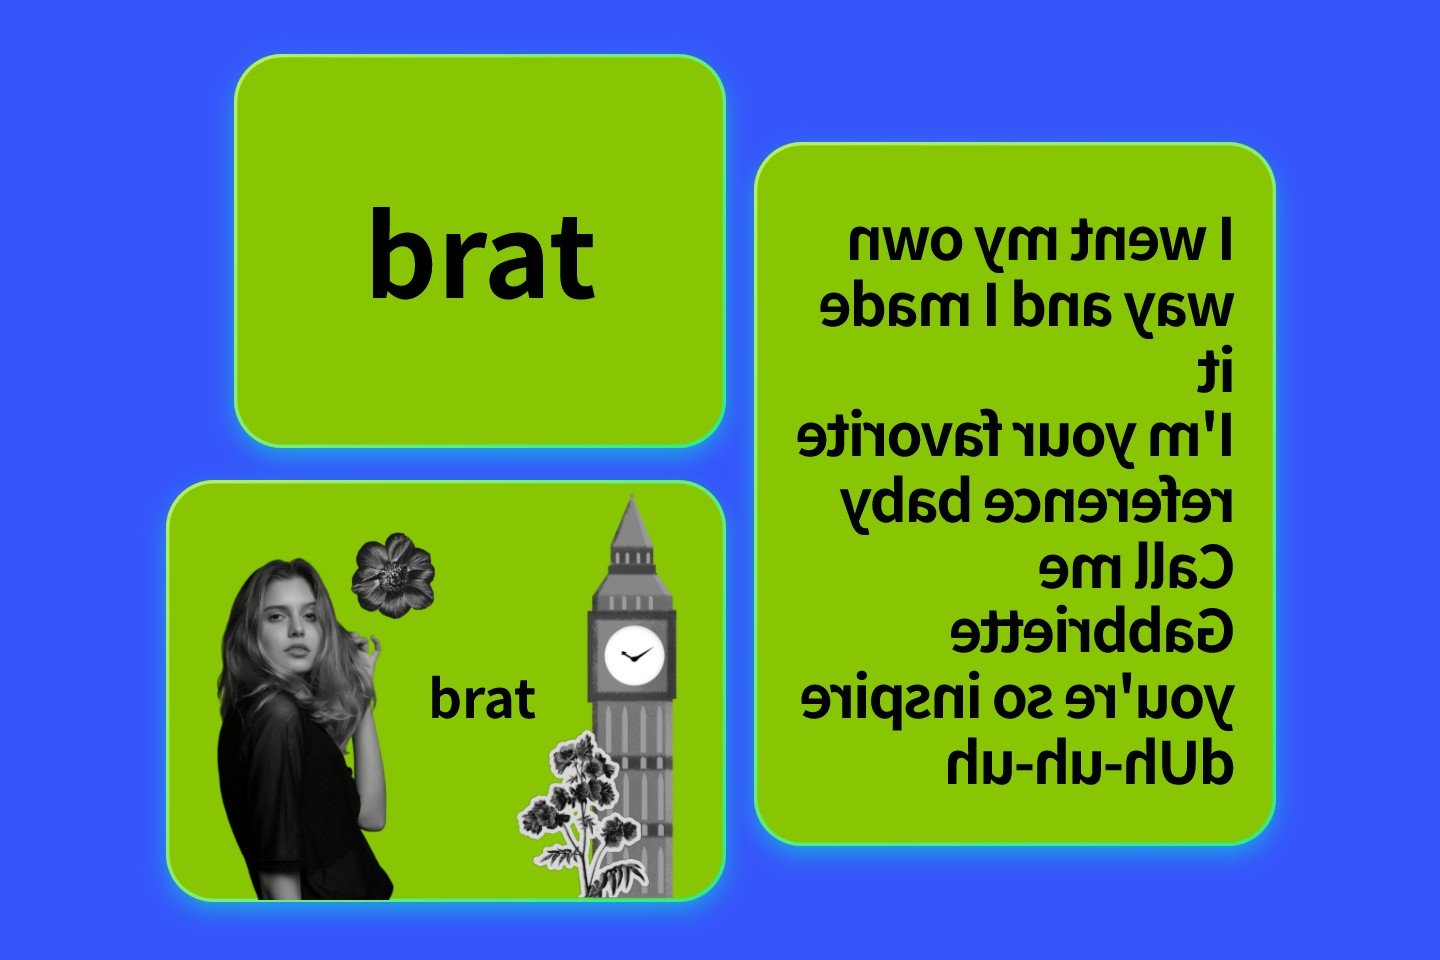
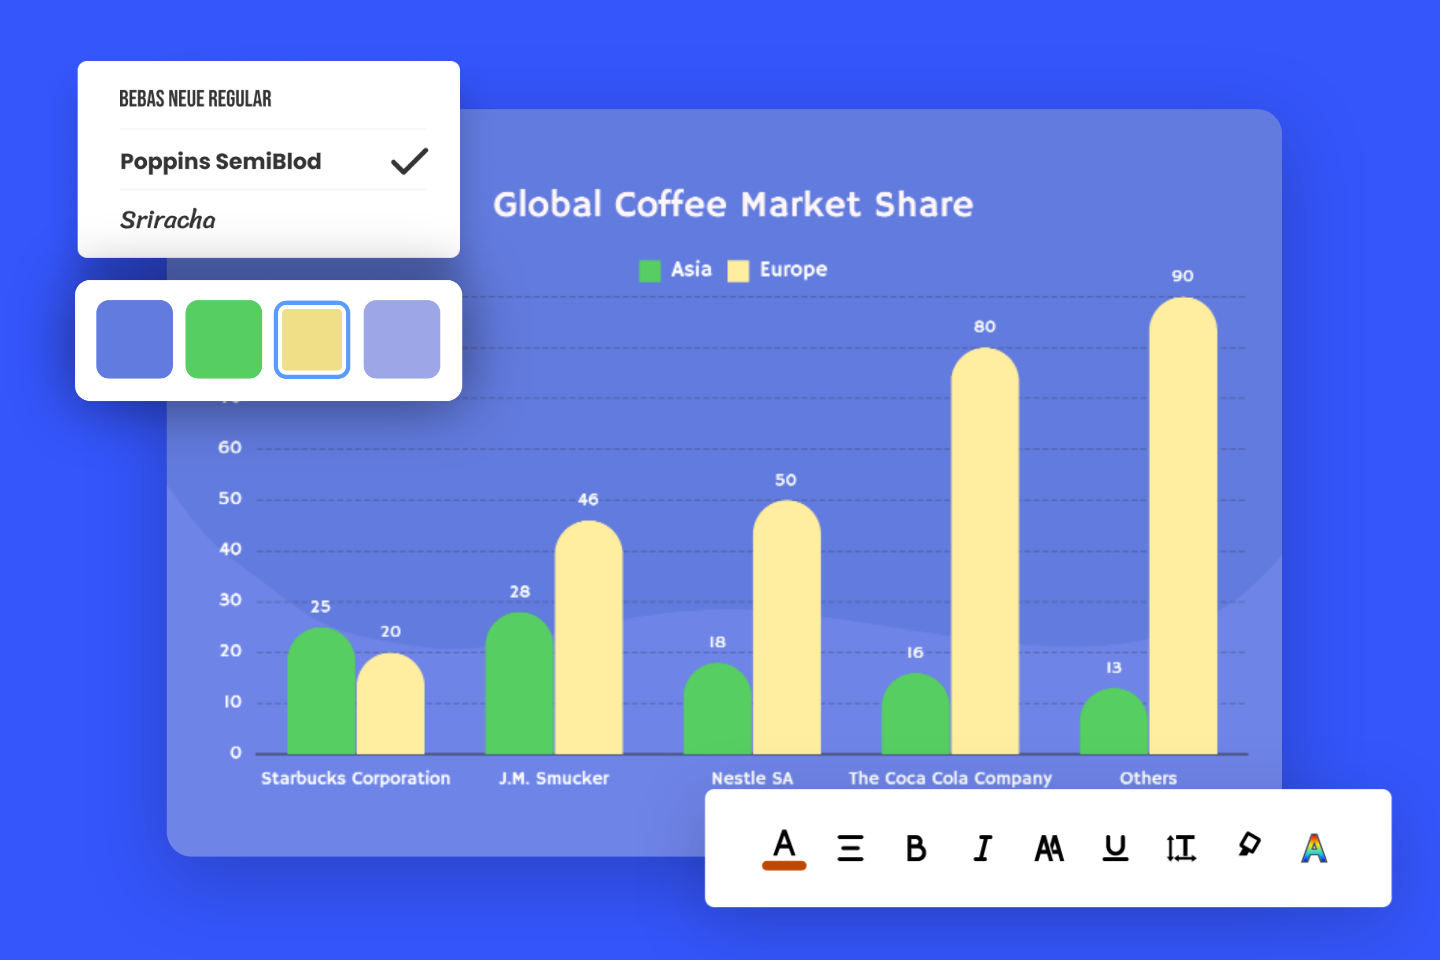
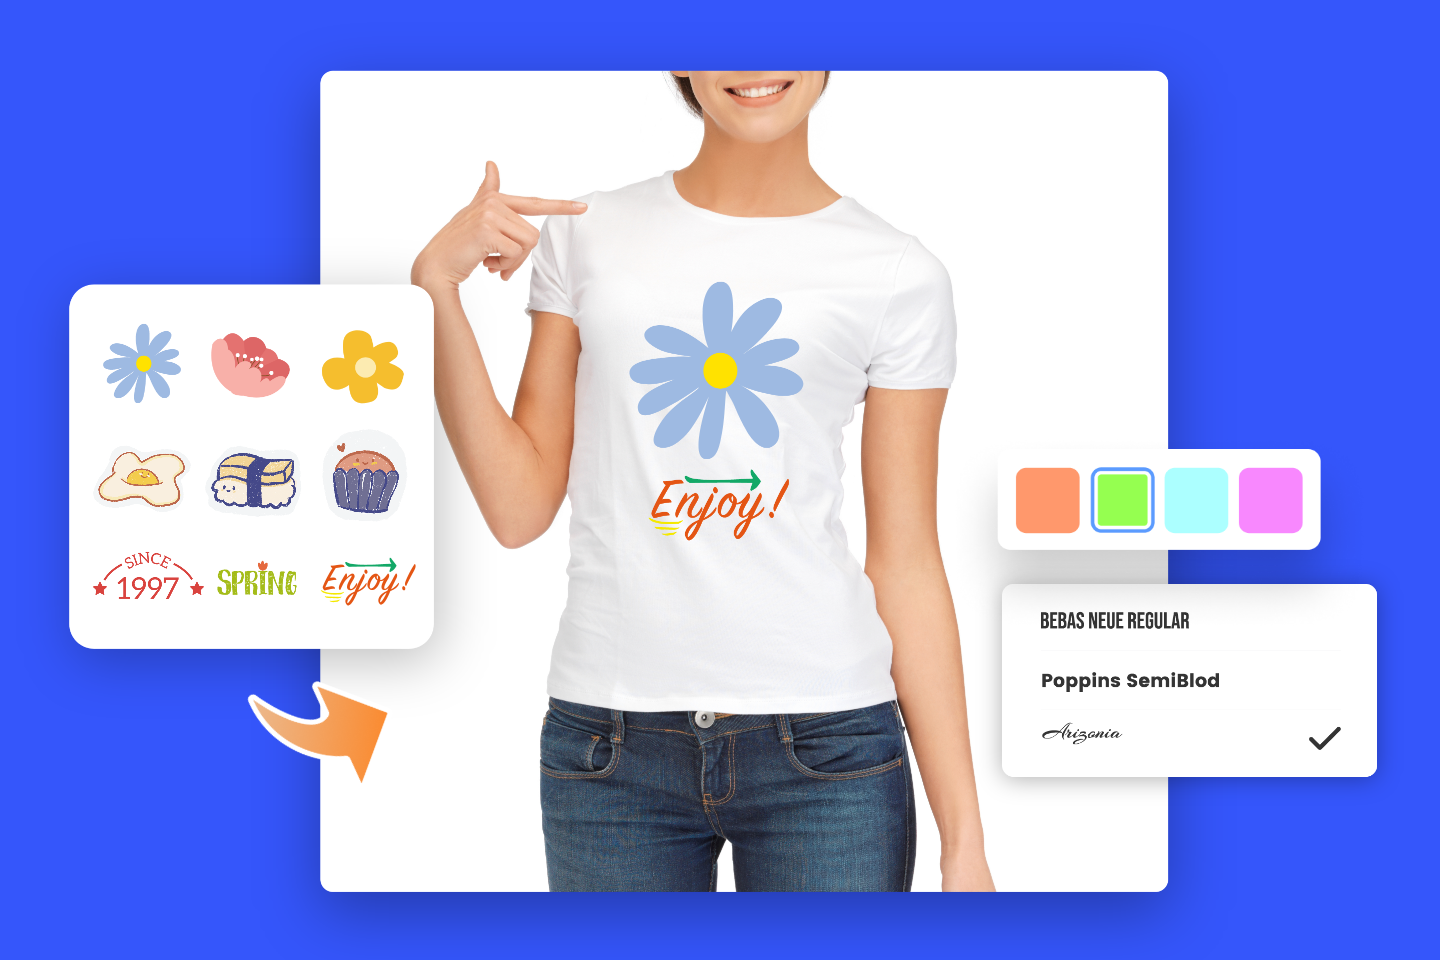
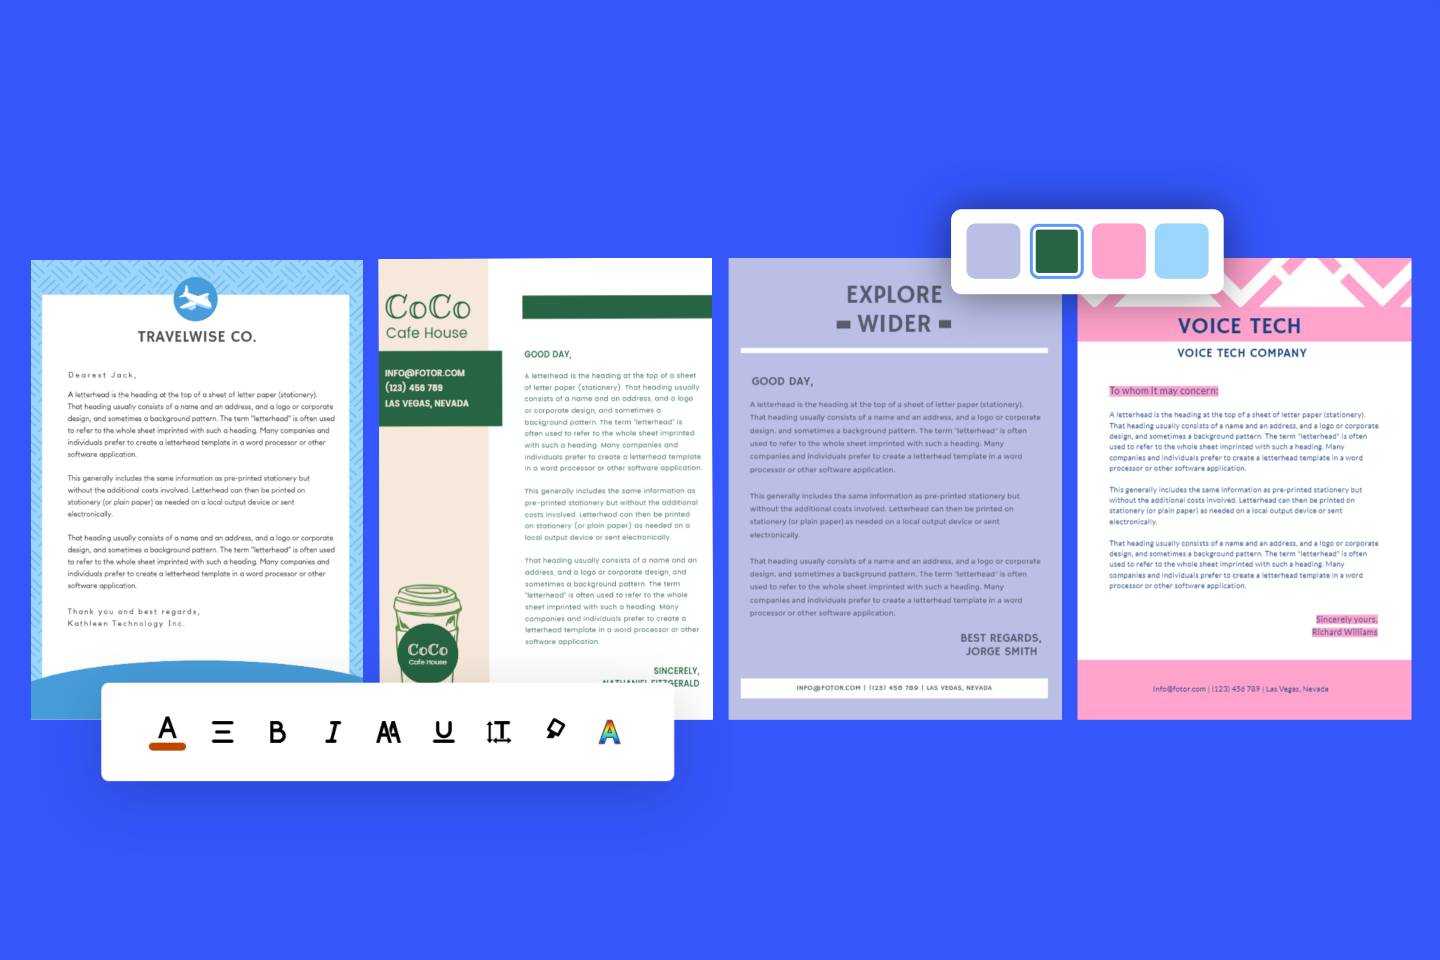
Explore Fotor’s comprehensive suite of graphic design maker tools. Access powerful online creators for social media, marketing, and personal projects, featuring professional templates and intuitive drag-and-drop design features.